A large language model trained with appropriate content can generate responses more than just English text. ChatGPT, for example, is known to be able to generate code in many programming languages. Indeed, you can make ChatGPT generate other content as well, such as pictures. In this post, you will learn
- How to make ChatGPT to generate block diagrams and sequence diagrams
- The general rules to make ChatGPT to create diagrams for you
Let’s get started.
Generating Diagrams with ChatGPT
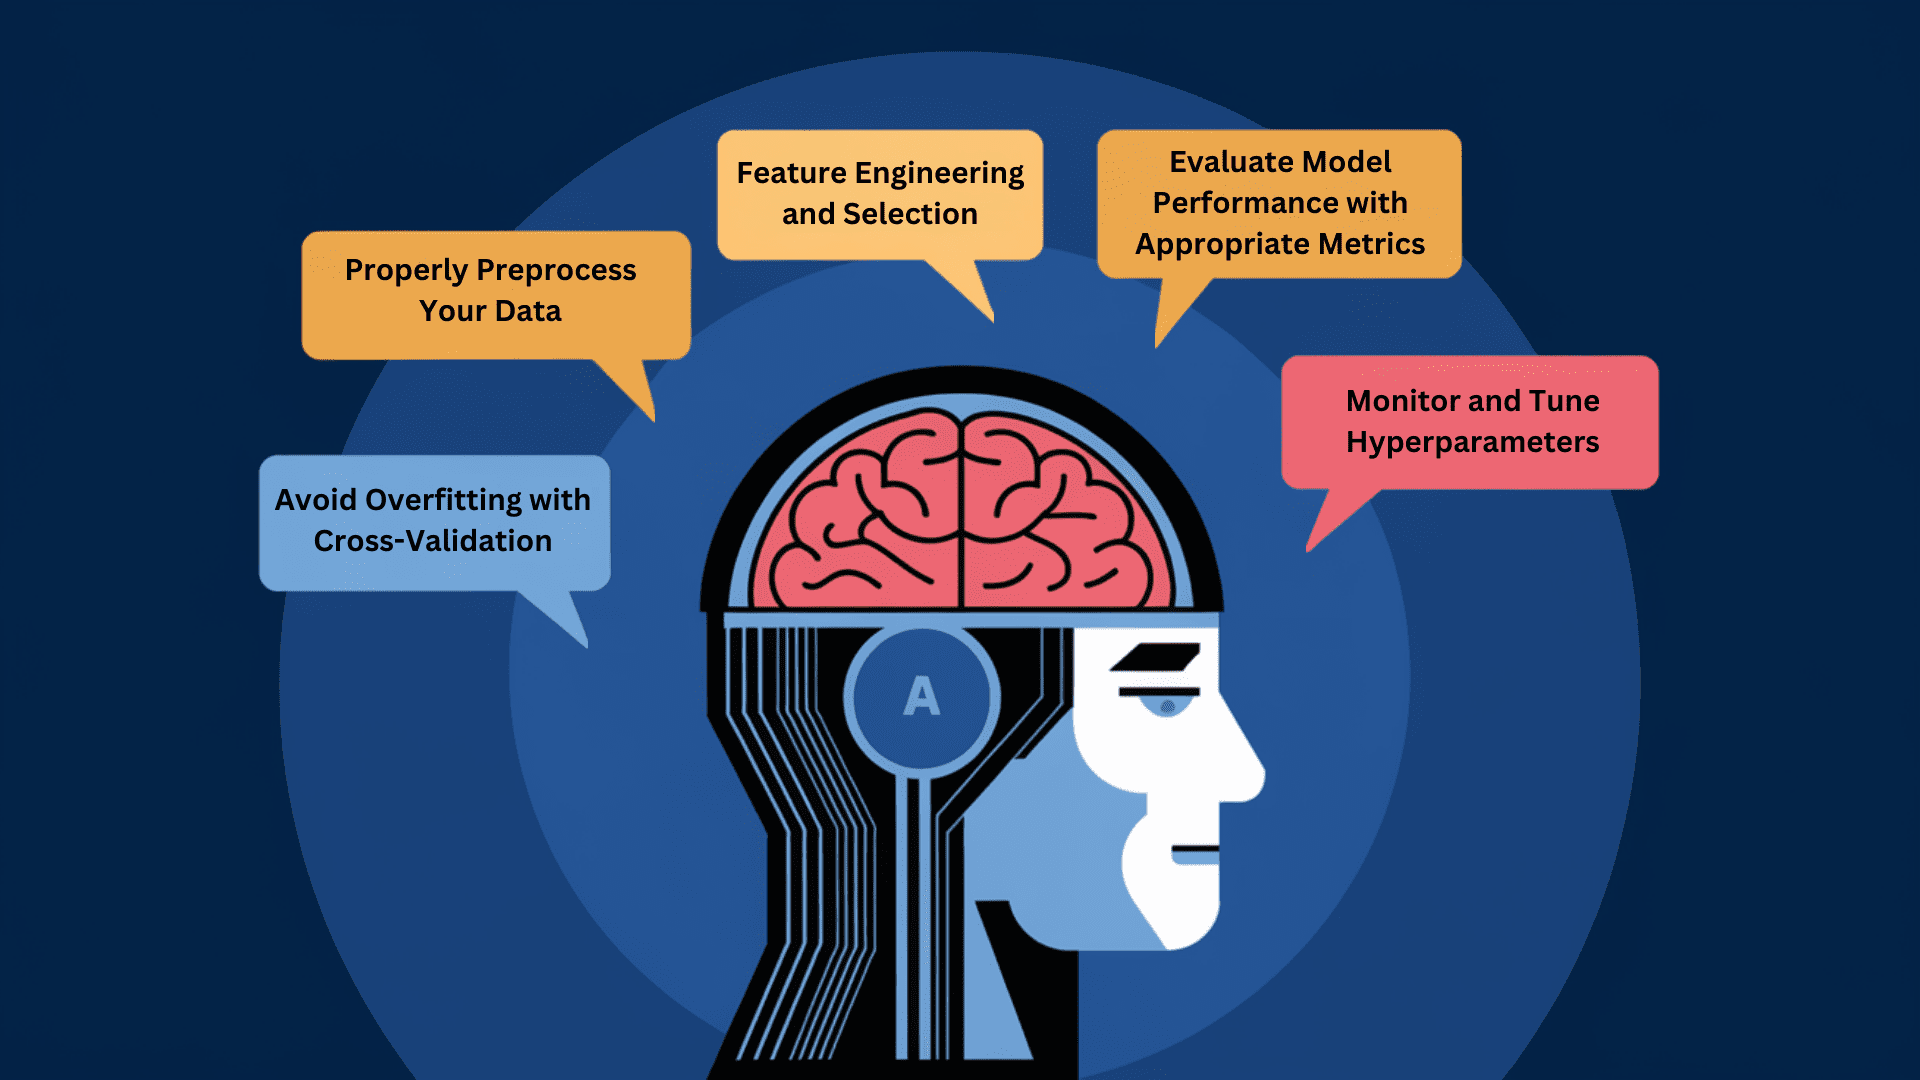
Picture generated by the author using Stable Diffusion. Some rights reserved.
Overview
This post is divided into three parts; they are
- Building a System Design Block Diagram
- Building a Sequence Diagram
- Limitations and Tips for Graphics Generation
Building a System Design Block Diagram
In today’s software industry, it is inevitable to consider scalability. That means a fairly large system has to be broken down into smaller pieces and run on segregated hardware. These pieces will collaborate over the network to finish a task. This contrasts the pre-Internet age when software was designed to be installed and run on a single computer.
Let’s consider a cloud-based file storage system that can interact with a mobile app. If you search on the Internet, it is not difficult to learn how such a system is built to support massive number of users. But a picture is worth a thousand words. You can describe such a system to ChatGPT and ask it to generate a picture. The prompt can be the following:
A cloud file storage service has the following components:
1. A mobile client that contains a local database, an index controller, a chunk controller, and a watcher components
2. The controllers and watcher components are interacting with the server side through a load balancer
3. There is a notification server at the server side that push messages such as files update to the client, which the watcher component at client will handle them
4. The upload and download of files are handled by a file processing server, which files are indexed and broken down into chunks. The chunks are stored in the cloud storage.
5. Metadata of files are processed by the metadata server and stored in the metadata database
6. All these operations are streamlined using a message queue built on top of Kafka.Please create a block diagram for this using the Mermaid syntax.
There are two key properties in constructing such prompt:
- You put down the system components and how they interact with each other clearly
- You request to use Mermaid syntax for the diagram
Giving the detail of what components should include and how they should interact is important to get the elements in the diagram right. However, ChatGPT can generate text but not graphics. In order to have the diagram, you need a graphics generation language that can present in plaintext form. Mermaid.js is one example.
The response from ChatGPT is as follows:
Sure! Here’s a block diagram representing the components and their interactions in the cloud file storage service:
1
2
3
4
5
6
7
8
9
10
11
12
13
14
15
16
17
18
19
20
21
22
23
24
25
26
27
28
29
30
31
32
33
34
35
mermaid
Copy code
graph TD
subgraph Mobile Client
A[Local Database] —> B[Index Controller]
B —> C[Chunk Controller]
C —> D[Watcher]
end
subgraph Server Side
E[Load Balancer] —> F[Controllers]
E —> G[Watcher]
F —> H[File Processing Server]
H —> I[Cloud Storage]
F —> J[Metadata Server]
J —> K[Metadata Database]
J —> L[Notification Server]
L —> G
end
subgraph Message Queue
M[Kafka]
end
A — Notify changes —> D
D — Watch events —> G
G — Notify events —> D
F — Upload/Download files —> H
H — Store/Retrieve chunks —> I
F — Process metadata —> J
J — Store metadata —> K
F — Push notifications —> L
L — Publish messages —> M
M — Subscribe to messages —> G
In this diagram, the mobile client consists of a local database, an index controller, a chunk controller, and a watcher component. These components interact with the server-side components through a load balancer. The server side consists of controllers, a file processing server, a metadata server, and a notification server. The file processing server handles the upload and download of files, breaking them down into chunks and storing them in the cloud storage. The metadata server processes the metadata of files and stores it in the metadata database. The notification server pushes messages, such as file updates, to the client, which are handled by the watcher component. All these operations are streamlined using a message queue built on top of Kafka.
Please note that this is a simplified representation, and there may be additional components or interactions depending on the specific implementation of the cloud file storage service.
The code block in the response is the diagram in Mermaid.js syntax. If you copy them to the Mermaid Live Editor online, the following is what you get:

Mermaid is a Javascript library that can render a variety of graphics on a web page. You may further polish the Mermaid code to add color or move the blocks to a different location on the canvas. However, it is a great help from ChatGPT already if you need a visualization of a system.
In fact, you can combine this technique with others, such as providing a system’s high-level goal to ChatGPT and asking it to tell you the system components. Then in the follow-up prompt, ask ChatGPT to convert this into a diagram.
You can try out the following prompt as an example:
What are the system components behind a social media like Twitter and how do they interact?
and then in the follow-up prompt,
Please provide a block diagram for the above in the Mermaid syntax.
Building a Sequence Diagram
As another example, let’s make ChatGPT generate a sequence diagram. It is another commonly used graphic in software engineering depicting how different components interact in a timeline.
Contrast to above, let’s make ChatGPT figure out the components and interactions and generate the picture in the same prompt:
How can a user interact with an webapp and login using OAuth2? Please generate a sequence diagram in PlantUML syntax to explain.
OAuth2 is a common way of authentication on webapps that the webapp server does not need you to create an account, but using other platform’s account instead. For example, you can use your Google account to login to ChatGPT. Google checks your password, but the application (ChatGPT) is not part of Google. There are multiple parties involved in the process.
The following is how ChatGPT explained this process to you:
Certainly! I can help you generate a sequence diagram in PlantUML syntax to illustrate how a user can interact with a web app and login using OAuth2. Here’s the diagram:
1
2
3
4
5
6
7
8
9
10
11
12
13
14
15
16
17
18
plantuml
Copy code
@startuml
actor User
participant “Web App” as WebApp
participant “OAuth2 Provider” as OAuthProvider
User -> WebApp: Access web app
WebApp -> User: Display login button
User -> WebApp: Clicks login button
WebApp -> OAuthProvider: Redirects user to OAuthProvider
User -> OAuthProvider: Enters credentials
OAuthProvider -> User: Validates credentials
OAuthProvider -> WebApp: Redirects user with authorization code
WebApp -> OAuthProvider: Sends authorization code
OAuthProvider -> WebApp: Sends access token
WebApp -> User: Logs in user
@enduml
In this diagram, the steps are as follows:
1. The User accesses the web app.
2. The Web App displays a login button to the User.
3. The User clicks the login button.
4. The Web App redirects the User to the OAuth2 Provider.
5. The User enters their credentials on the OAuth2 Provider’s login page.
6. The OAuth2 Provider validates the User’s credentials.
7. The OAuth2 Provider redirects the User back to the Web App with an authorization code.
8. The Web App sends the authorization code to the OAuth2 Provider.
9. The OAuth2 Provider exchanges the authorization code for an access token.
10. The OAuth2 Provider sends the access token back to the Web App.
11. The Web App logs in the User using the access token.Please note that this diagram provides a high-level overview of the OAuth2 login process and may not include all the intricacies of the protocol or specific implementation details. It serves as a simplified representation of the general flow.
Here you asked for a different “language” of the graphics syntax: PlantUML. You can copy the code above and run it on the PlantUML Online Server. The picture you get is the following:

The sequence diagram explains how the login and authentication happened and how the access token was created.
Note that this works because ChatGPT can accurately articulate how this process works. If your process is too complicated or not known by ChatGPT, you should provide the detail of how the different components interact in the prompt and ask ChatGPT to convert your description into a graphics language.
Limitations and Tips for Graphics Generation
As a language model, its training data largely limits its capability. Generating graphics is probably not the primary interest in building ChatGPT. It is well known that ChatGPT is weak at some graphics, such as schematic diagrams of electronic circuits.
Also note that if you ask ChatGPT to give you a diagram, by default it assumed you mean some kind of “ASCII art”, which usually doesn’t look right. Therefore it is essential to specify some kind of graphics language to use and then you render the output into graphics. Below are some examples:
- Mermaid, as you saw in the first example above, can make flowcharts, sequence diagram, entity-relationship diagram, Gantt chart, and mindmaps
- PlantUML, as used in another example above, can make a lot of UML diagrams, including sequence diagram, state diagram, and class diagram
- For other simple graphics (e.g., those with only nodes and arrows), you can ask for the Graphviz syntax, also known as the “dot language”
- For generic graphics, you can ask for TikZ syntax, which is a package in LaTeX
- For circuits, there is circuitikz which is a specialized version of TikZ
Summary
In this post, you learned that ChatGPT can generate not only text, but also graphics, albeit in the form of some graphics language. Specifically, you saw how ChatGPT can
- generate a block diagram depicting the interaction of different parties according to your description
- generate a sequence diagram to explain a complex logic to answer your question
Most importantly, the key to making ChatGPT generate graphics is to give enough details on how the graph should be generated. You should specify the format (e.g., in Mermaid syntax) and provide enough detail about what should be on the visualization.
